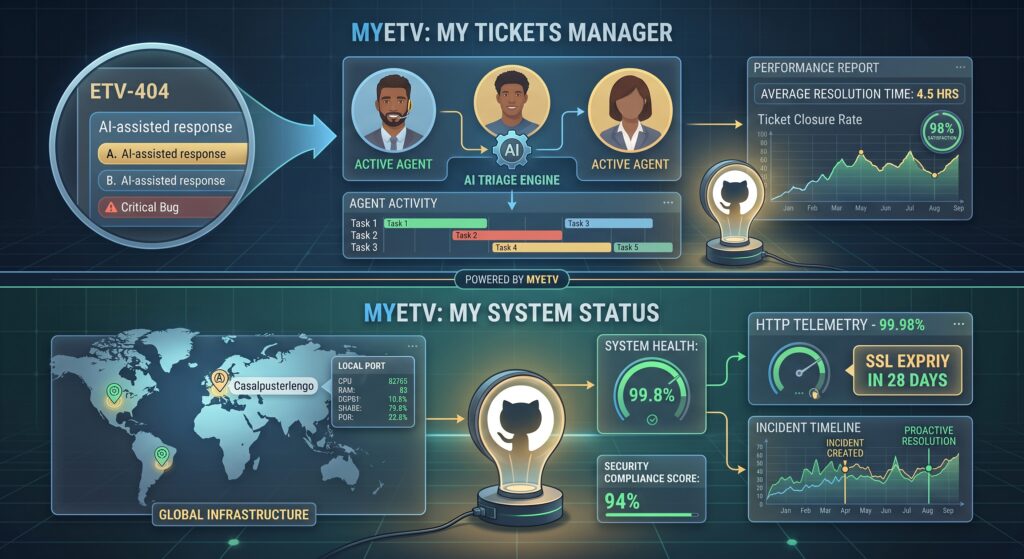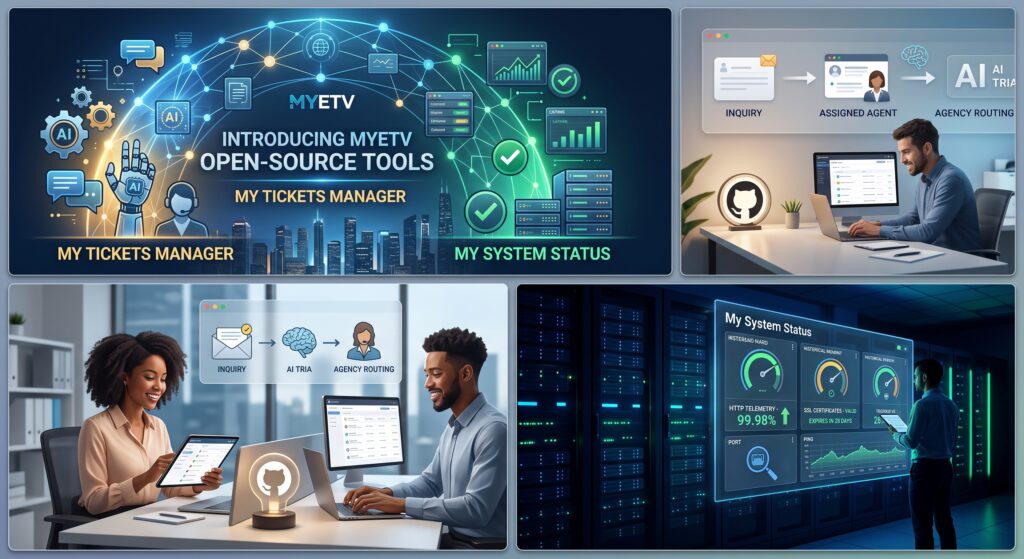
At MYETV, transparency, efficiency, and community-driven development form the core of our technical strategy. Today, we are excited to announce the official release of two major open-source projects built completely in-house: My Tickets Manager and My System Status.
Both platforms are published under open-source licenses and are designed to empower developers, system administrators, and organizations to maintain full control over their customer support workflows and infrastructure telemetries—without relying on costly proprietary third-party SaaS alternatives.
Below is an in-depth, comprehensive architectural walkthrough of both applications, detailing their core philosophy, underlying data engines, security layers, and deployment paradigms.
1. My Tickets Manager: scalable AI-powered helpdesk engine
MYETV HelpDesk: https://support.myetv.tv
Repository Open Source: https://github.com/MYETV/My-Tickets-Manager
Operational Architecture & Lifecycle Flow
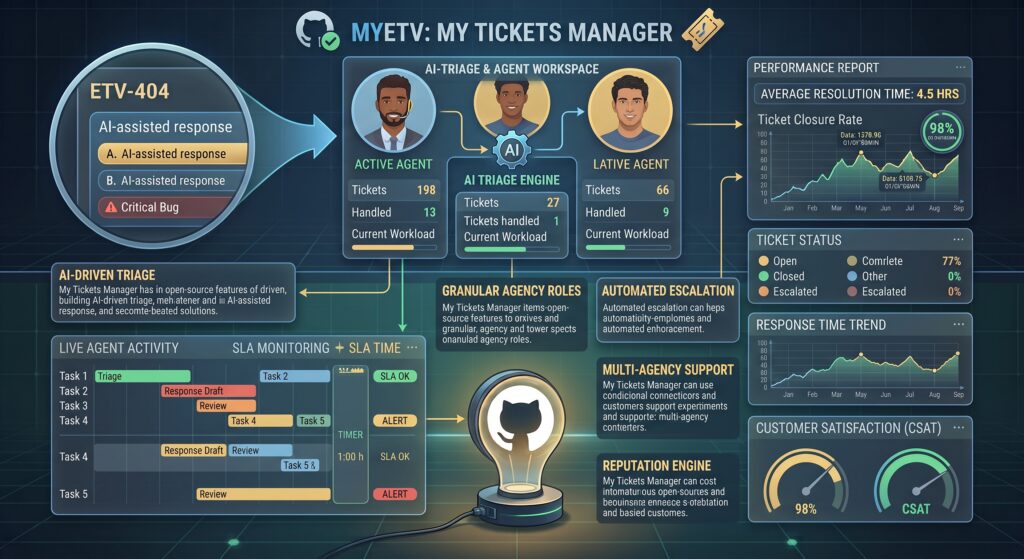
In modern web infrastructure, handling customer inquiries and technical support requests requires a deterministic flow that balances automated processing with human intervention. My Tickets Manager structures the lifecycle of a support request into clear operational stages:
- Client Ingress Layer: End-users submit inquiries through a streamlined public or authenticated portal. Inputs undergo validation, sanitization, and structured data transformation.
- AI Analysis & Automation Pipeline: As requests hit the ingestion queue, integrated local or remote AI inference models parse the context to perform natural language triage, sentiment evaluation, category determination, and urgent flag assignment.
- Multi-Agency Routing Core: Categorized tickets are dispatched to target agencies or specialized internal teams based on capacity, current agent workloads, and assigned domain expertise.
- Agent Workspace & Resolution Engine: Support personnel interact with an isolated workspace, accessing history, internal notes, smart draft responses, and lifecycle transition controls.
Overview & Core Philosophy
Managing user requests across modern web applications requires speed, granularity, and intelligent routing. My Tickets Manager was built to bridge the gap between simple contact forms and overly complex enterprise ticketing platforms. It delivers an operational environment capable of managing multi-department, multi-agency ticketing flows while maintaining minimal server resource consumption.
Key features & Architectural capabilities
Multi-Agency & Agent Hierarchy
Large-scale organizations and modern web platforms frequently operate across multiple distinct brands, divisions, or specialized support teams. My Tickets Manager handles this complexity seamlessly through isolated multi-agency architecture:
- Agency Isolation: Organize agents into logical agencies or departments with independent ticket pools, custom notification triggers, and isolated queue views.
- Granular Role-Based Access- [Access the simple access to a website as a visitor] - Control (RBAC): Assign fine-grained permission levels to administrators, agency heads, tier-1/tier-2 support agents, and read-only auditors.
- Workload Distribution: Balance incoming tickets automatically among available agents based on active ticket caps, current agent status, and time-zone coverage.
Native Artificial Intelligence Integration
Automation is central to scaling customer support operations without exponentially increasing overhead. My Tickets Manager incorporates AI-assisted capabilities directly into the ticket resolution pipeline:
- Automated Triage & Categorization: Incoming requests are parsed by language models to automatically extract intent, assign tags, evaluate priority levels, and route tickets to the appropriate agency.
- Smart Reply Generation: Support representatives can trigger context-aware AI response drafts, significantly reducing turnaround times for common troubleshooting steps while keeping full control in human hands.
- Sentiment & Urgency Scoring: Evaluate user sentiment in real time to highlight frustrated users or critical service disruptions before manual review occurs.
Custom Workflows & SLA Management
Enforcing response standards is vital for maintaining service quality. The application provides robust Service Level Agreement management and custom workflow controls:
- Service Level Agreements (SLAs): Configure precise time-to-first-response and time-to-resolution targets, complete with automated escalation paths when SLAs risk being breached.
- Configurable Ticket States: Expand beyond simplistic status flags with tailored state machines (e.g., Pending User Input, Escalated to Engineering, Vendor Review, Resolved).
- Complete Audit Logging: Every action taken on a ticket, including status shifts, internal notes, priority changes, and re-assignments, is recorded with timestamped audit entries.
2. My System Status: full-stack uptime & performance monitoring
MYETV system status: https://status.myetv.tv
Repository: https://github.com/MYETV/My-System-Status
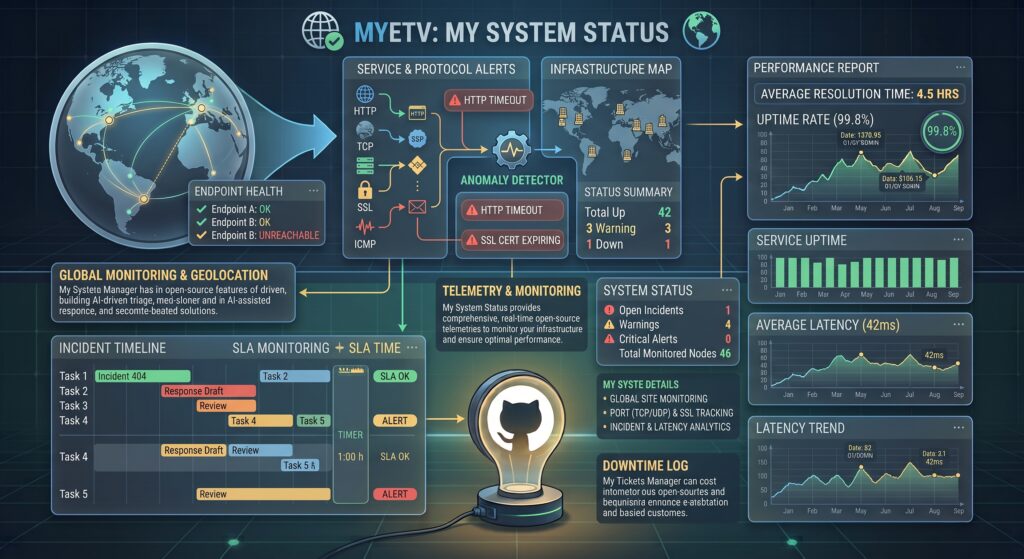
Telemetry architecture & Inspection layer
System reliability requires continuous multi-layer inspection across transport, network- [Network of Contents: is the channel in which owners can post their content and the audience can see the contents posted by the owners] - , and application protocols. My System Status operates an efficient monitoring model designed to continuously poll and log resource metrics:
- Active Protocol Checkers: Independent execution routines execute non-blocking protocol checks across web endpoints, open network ports, transport protocols, and ICMP channels.
- Telemetry & Time-Series Metrics Engine: Inspection results, including response times, status codes, packet loss rates, and certificate validity windows, are serialized into historical databases.
- Incident & Event Dispatcher: When metric thresholds are violated or service drops occur, the state engine generates incident records, updates telemetry graphs, and sends out alerts.
- Dashboard Presentation Engine: Aggregated metric streams are compiled into clean public status portals for users or secure administrative dashboards for operations teams.
Overview & Core philosophy
Knowing when a service degrades or fails before your users do is critical. My System Status is a high-performance telemetry engine designed to continuously audit network infrastructure, web endpoints, transport layers, and security certificates, delivering real-time status updates through customizable dashboards.
Technical modules & Capabilities
Comprehensive Protocol Checks
Modern web applications rely on a complex web of interconnected services. My System Status offers wide monitoring coverage to catch failures at every layer:
- HTTP / HTTPS Telemetry: Monitor web endpoint availability, track HTTP status codes (2xx, 3xx, 4xx, 5xx), measure exact response latency, and validate expected payload substrings.
- TCP Port Monitoring: Conduct socket-level health checks across key infrastructure ports such as database connections, custom API gateways, SSH, and mail servers.
- SSL/TLS Certificate Tracking: Monitor certificate expiration dates, validation chains, and cipher standards, providing early warnings long before certificates expire.
- ICMP Ping & Latency Telemetry: Keep track of core network stability, packet loss, and round-trip times to identify routing degradation before complete outages occur.
- Plugins and Cloudflare integrations: We haven’t stopped at just monitoring local services; we have built plugins capable of monitoring external services such as PayPal, Stripe, Cloudflare, and many others. Furthermore, we have developed a system that integrates fully with Cloudflare Workers, allowing you to perform ping checks and keep your service online even when the servers hosting your platform- [Platform: the set of the main domain and all the subdomain of a particular website; also the computer architecture and equipment using a particular operating system] - are down.
Dashboard & Incident Management
Clear communication during an outage builds trust with users and streamlines technical response:
- Public & Internal Dashboards: Deploy user-facing status pages to keep customers informed, or maintain internal dashboards for DevOps and operations teams.
- Maintenance Management: Handle any maintenance tasks manually, and if you wish, you can also use artificial intelligence to help draft a text to present to the public.
- Incident Lifecycle Management: Manage service disruptions with structured updates covering investigation, identification, monitoring, and resolution stages.
- Historical Performance Analytics: Visualize trends over customizable timeframes (24 hours, 7 days, 30 days, or longer) to track latency improvements and long-term SLA compliance.
3. Comparative feature matrix
While both applications work together to form a robust operational foundation, they address distinct operational needs. The matrix below summarizes their technical focus and capabilities:
| Feature Category | My Tickets Manager | My System Status |
| Primary Domain | Customer Support, Helpdesk & Case Management | Infrastructure Telemetry & Service Uptime |
| Target Audience | Support Agents, Agency Leads, end-users | System Administrators, DevOps, Site Reliability Engineers |
| AI Capabilities | Smart Triage, Intent Tagging, Auto-Replies, Sentiment Scoring | Anomaly Detection, Performance Baseline Analytics |
| Primary Data Model | Relational Entities, State Transitions, Audit Logs | Time-Series Metrics, Polling Logs, Incident Logs |
| User Interface | Helpdesk Portal, Agent Workspace, Agency Management | Public Status Pages, Real-time Operations Dashboards |
| Licensing Model | 100% Open-Source (GitHub Hosted) | 100% Open-Source (GitHub Hosted) |
4. Getting started & Installation
Both applications were designed with ease of deployment, customizability, and efficient resource usage in mind.
Setting up My Tickets Manager
To deploy the ticket management platform on your server environment, clone the project repository and execute the initial setup:
# Clone the open-source repository
git clone https://github.com/MYETV/My-Tickets-Manager.git

# Navigate into the project directory
cd My-Tickets-Manager

# Follow the standard installation guide in README.md to configure your database and web server
Setting up My System Status
To deploy the telemetry and uptime monitoring engine, clone the project repository and set up your monitoring intervals:
# Clone the open-source repository
git clone https://github.com/MYETV/My-System-Status.git

# Navigate into the project directory
cd My-System-Status

# Follow the setup instructions in README.md to configure telemetry schedules and status pages
5. Joining the Open-Source ecosystem
By releasing My Tickets Manager and My System Status under open-source licenses, MYETV reinforces its dedication to building transparent, reliable, and accessible software- [Program/Software: the instructions that control what a computer does; computer programs] - for developers and organizations worldwide. We actively welcome community participation!
- Issue Reporting: Encounter a bug or have a feature request? Submit a detailed issue directly on GitHub.
- Pull Requests: We welcome community contributions, including security hardening, UI refinements, localization, and new core feature additions.
- Custom Adaptations: Fork either codebase to tailor functionality to your specific operational environment.
Explore the official code repositories today:
- My Tickets Manager on GitHub:github.com/MYETV/My-Tickets-Manager
- My System Status on GitHub:github.com/MYETV/My-System-Status
Don’t forget to leave a few stars for the repository author: https://github.com/OskarCosimo